文章目录
Komari 简介
轻量级自托管服务器监控
快速部署监控面板,连接你的节点,把关键状态放在清爽的 Web 仪表盘里。
官网:https://komari-document.pages.dev/
github:https://github.com/komari-monitor/komari
服务端安装
1panel 安装:https://komari-document.pages.dev/install/1panel
1panel 的话直接在应用商店搜索:Komari 直接安装即可。
安装后,默认端口号是:25774(记得去云主机后台开放对应端口)
客户端(节点)安装
1、登录服务端,添加“节点”,如图:
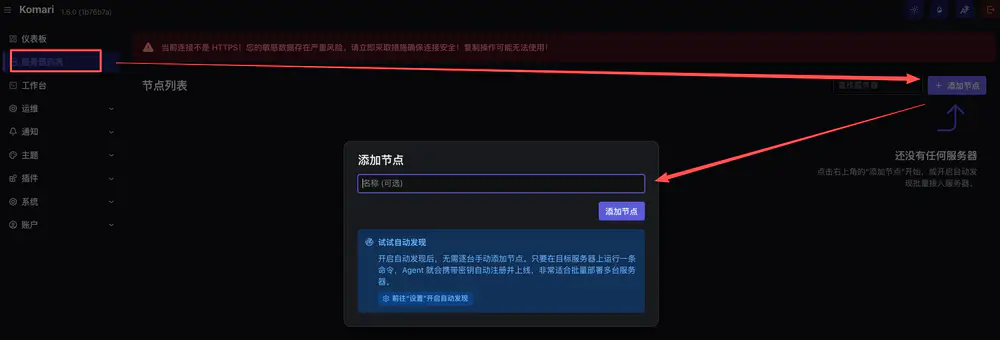
2、复制节点指令
wget -qO- https://raw.githubusercontent.com/komari-monitor/komari-agent/refs/heads/main/install.sh | sudo bash -s -- -e http://你的komari服务器IP:25774 -t UFOuyUue8mgSVBLBcWDrmJ
3、复制指令后,直接进入客户端的终端运行即可。
⚠️注意:遇到了一个问题,国内的主机有些无法下载。复制后客户端毫无反应。
解决办法:
一般没有安装成功,大概率是下载的问题,有些国内服务器无法访问 github 下载。所以,换个方式
第一步:复制以下代码直接安装。(这个是github 的加速代码)
curl -fL --connect-timeout 10 --max-time 60 \
  'https://ghfast.top/https://raw.githubusercontent.com/komari-monitor/komari-agent/refs/heads/main/install.sh' \
  -o /tmp/komari-agent-install.sh
第二步:复制以下代码直接执行,⚠️注意:里面的 token 就是刚才客户端生成的一串文字,如图:
sudo bash /tmp/komari-agent-install.sh \
  --install-ghproxy https://ghfast.top \
  -e http://这里写你的ip地址以及端口号 \
  -t '你的新Token'
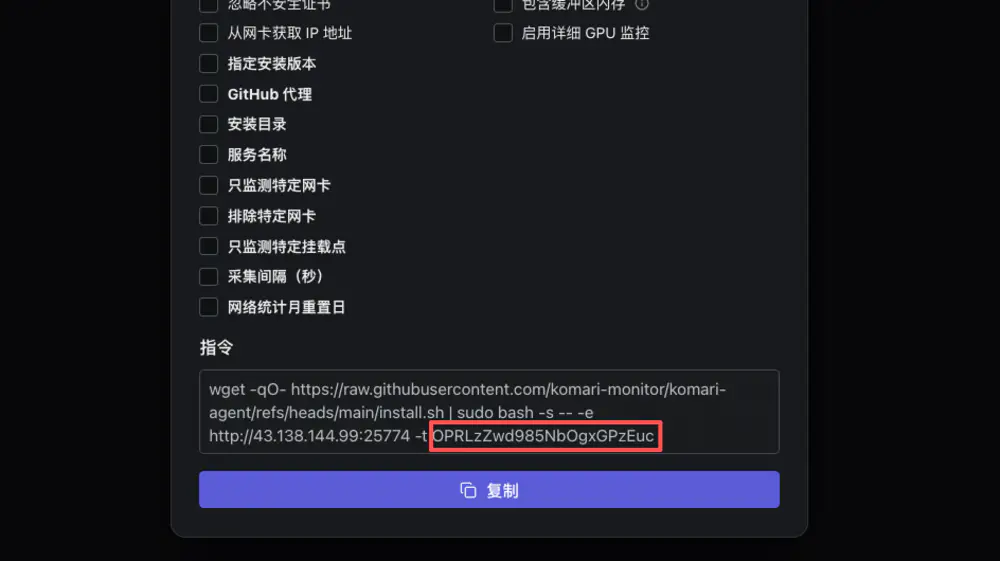
安装完成后,记得检查运行状态:
systemctl is-active komari-agent
排查办法:
sudo systemctl is-active komari-agent
上面这段代码主要是看 agent 有没有安装并运行👆
active:正在运行。
inactive / failed:没有运行或启动失败。